Visualisations
I have always enjoyed describing my work through visualisations. Below is a small selection of figures I have created, with the majority made in Python.
Magnetosphere-Ionosphere Coupling
Earth’s ionosphere interacts with the Sun through the solar wind and magnetosphere. We use MHD and AI models to predict key physical quantities such as potential and current. These predictions help us determine the energy input into the upper atmosphere, which in turn informs us about the potential impacts on technological systems like satellites and power grids.
Total Electron Content
Total Electron Content (or TEC) tells us how many electrons are in the atmosphere. TEC tells us how the ionosphere is responding space weather, the Sun, and the atmosphere from below, and forms a key part in modelling activities.
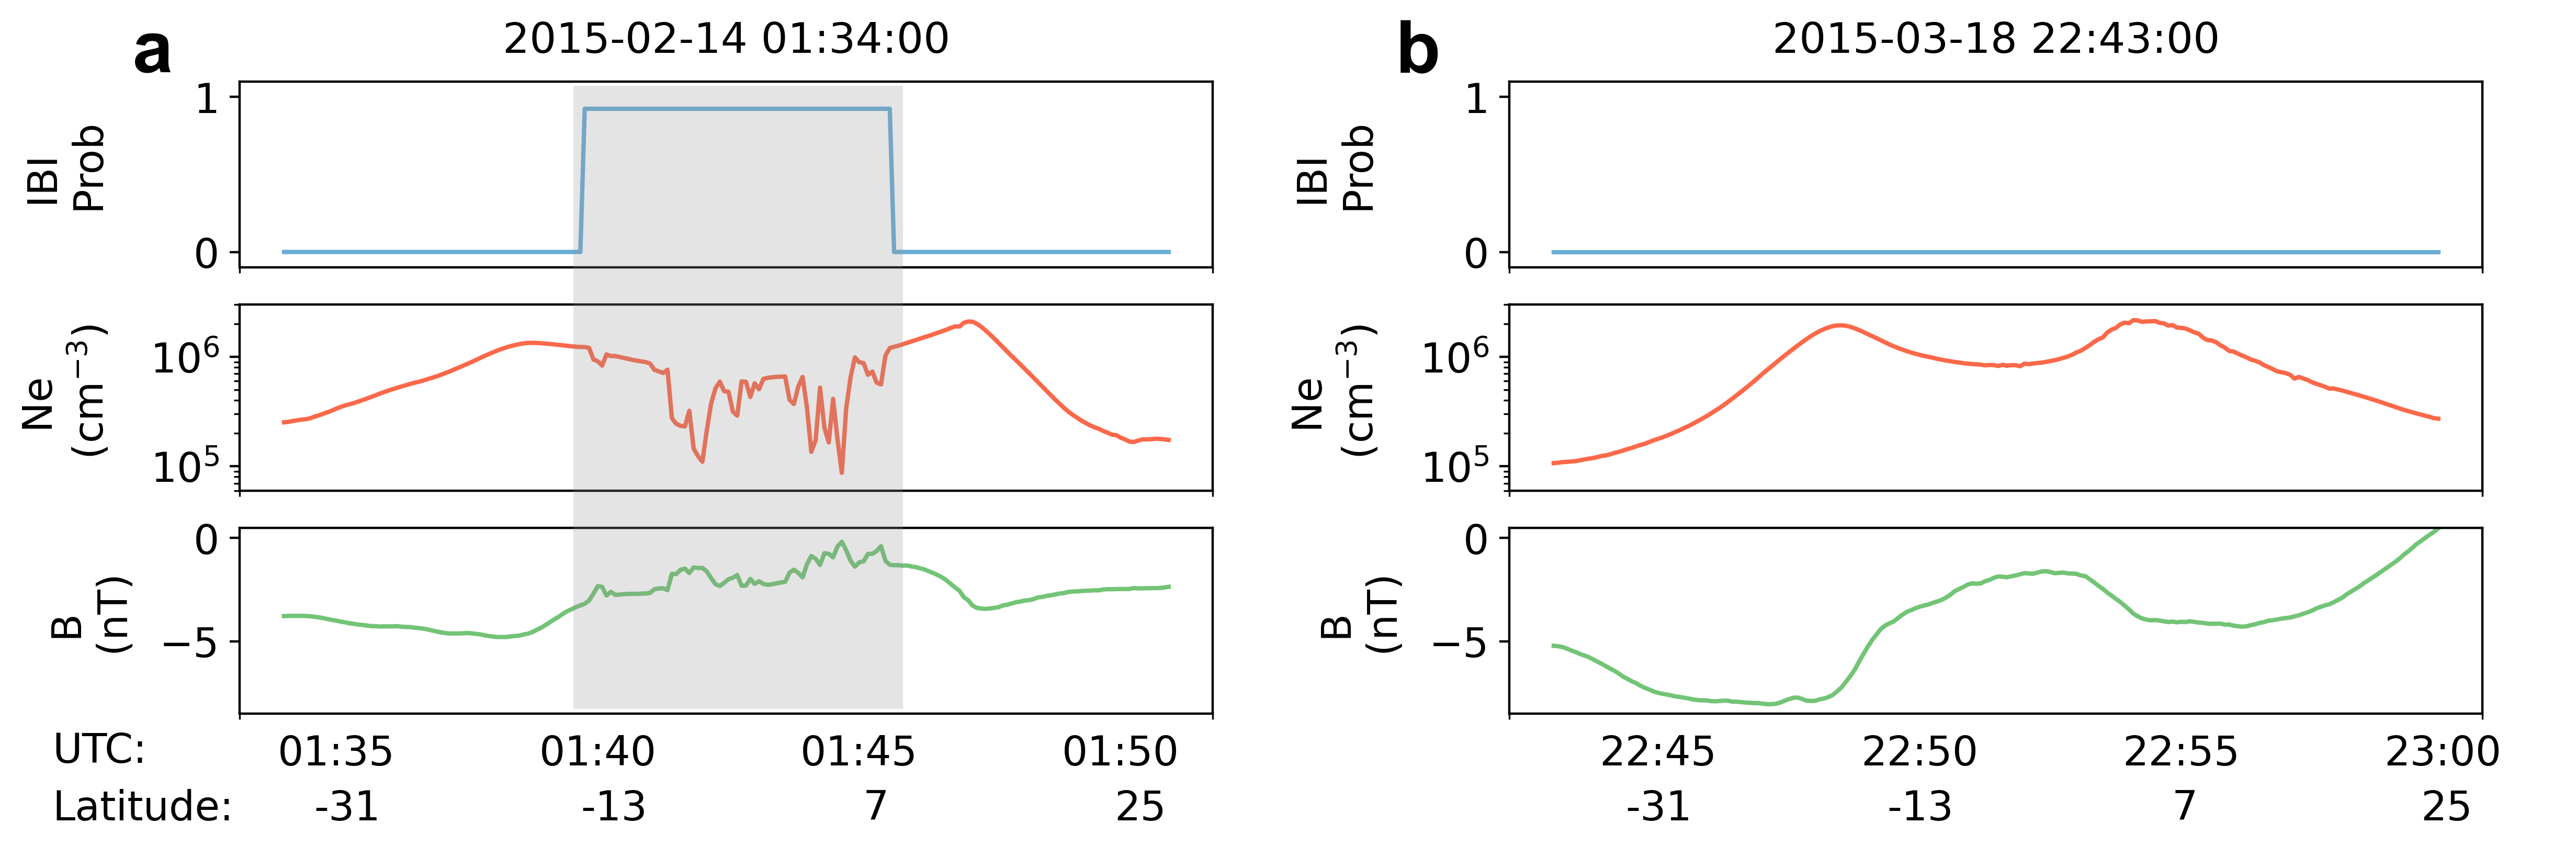
Plasma Bubbles
Ever wondered why your GPS sometimes plays up? It could be because of something called ‘Equatorial Plasma Bubbles.’ EPBs can intefere with GNSS signals, affecting everything from plane tracking to finding your way to a new restaurant. By predicting when and where these bubbles might occur, we can better safeguard our communication and navigation systems, ensuring they stay reliable when we need them most.
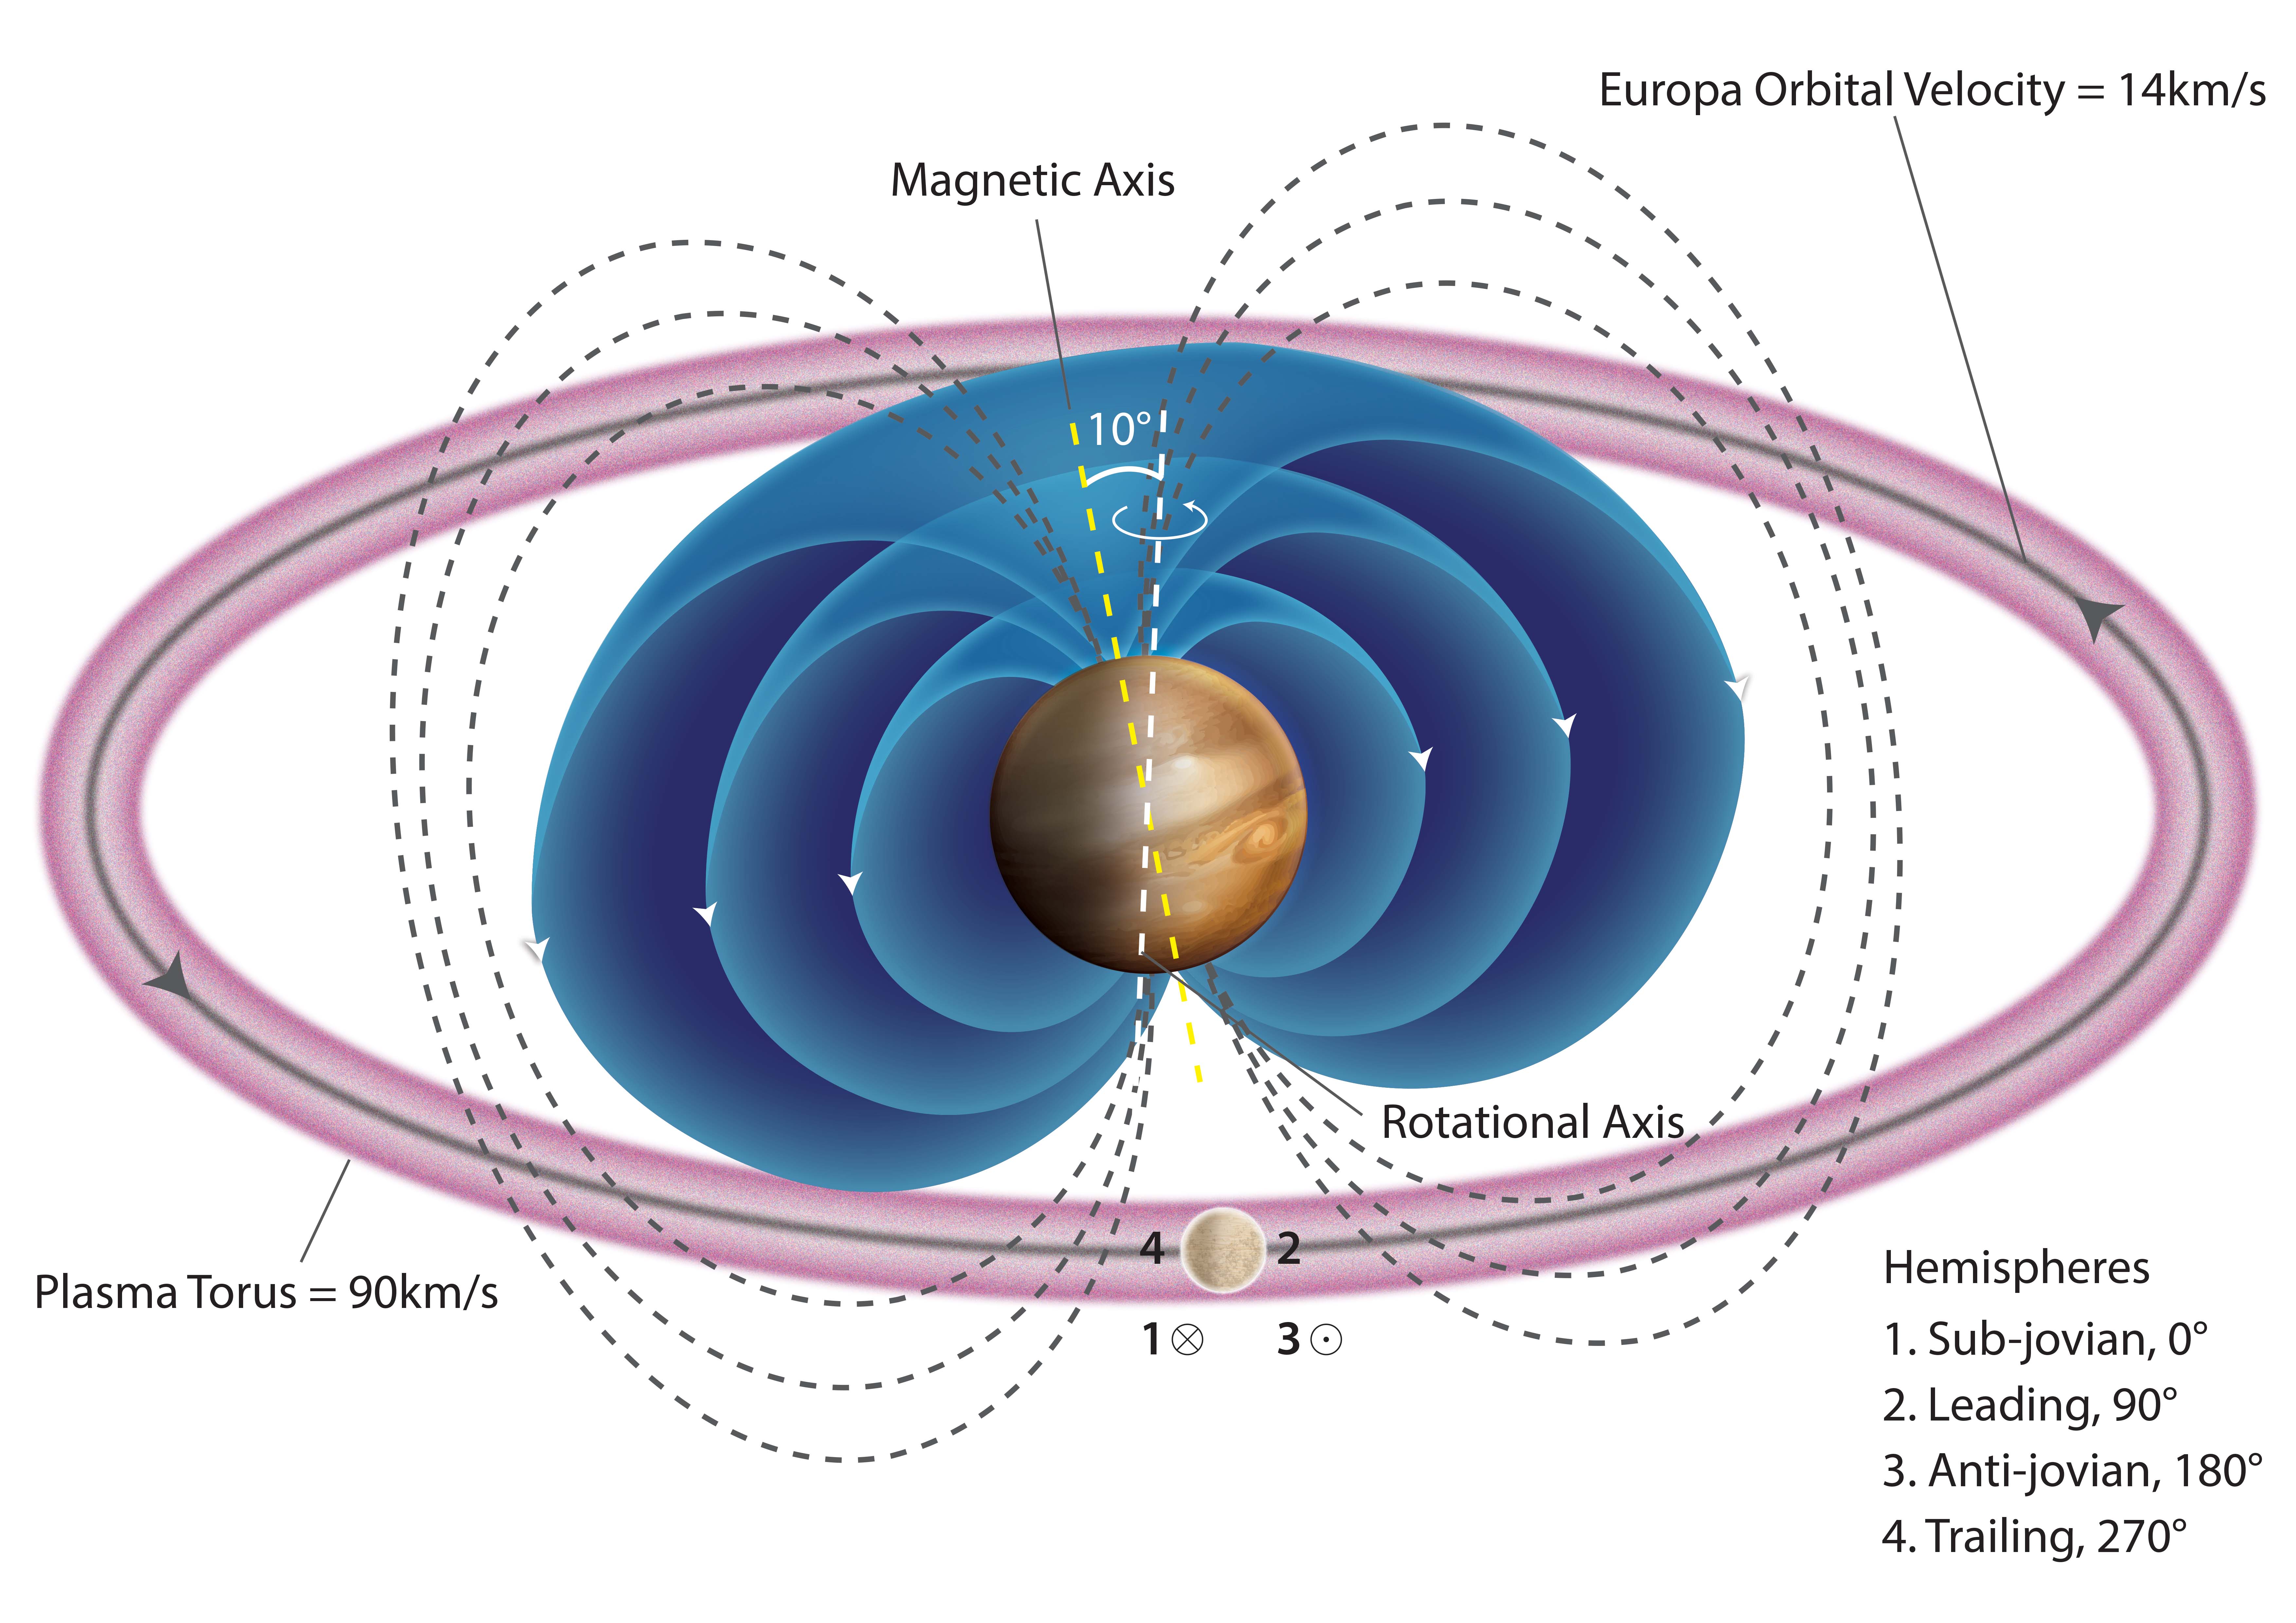
Europa and Jupiter
Europa has been identified as a prime target in the search for life beyond Earth. To understand its habitability we analyse data, create models and run simulations. We will have many more answers (and questions!) when Europa Clipper and JUICE arrive at the icy moon in the 2030’s.
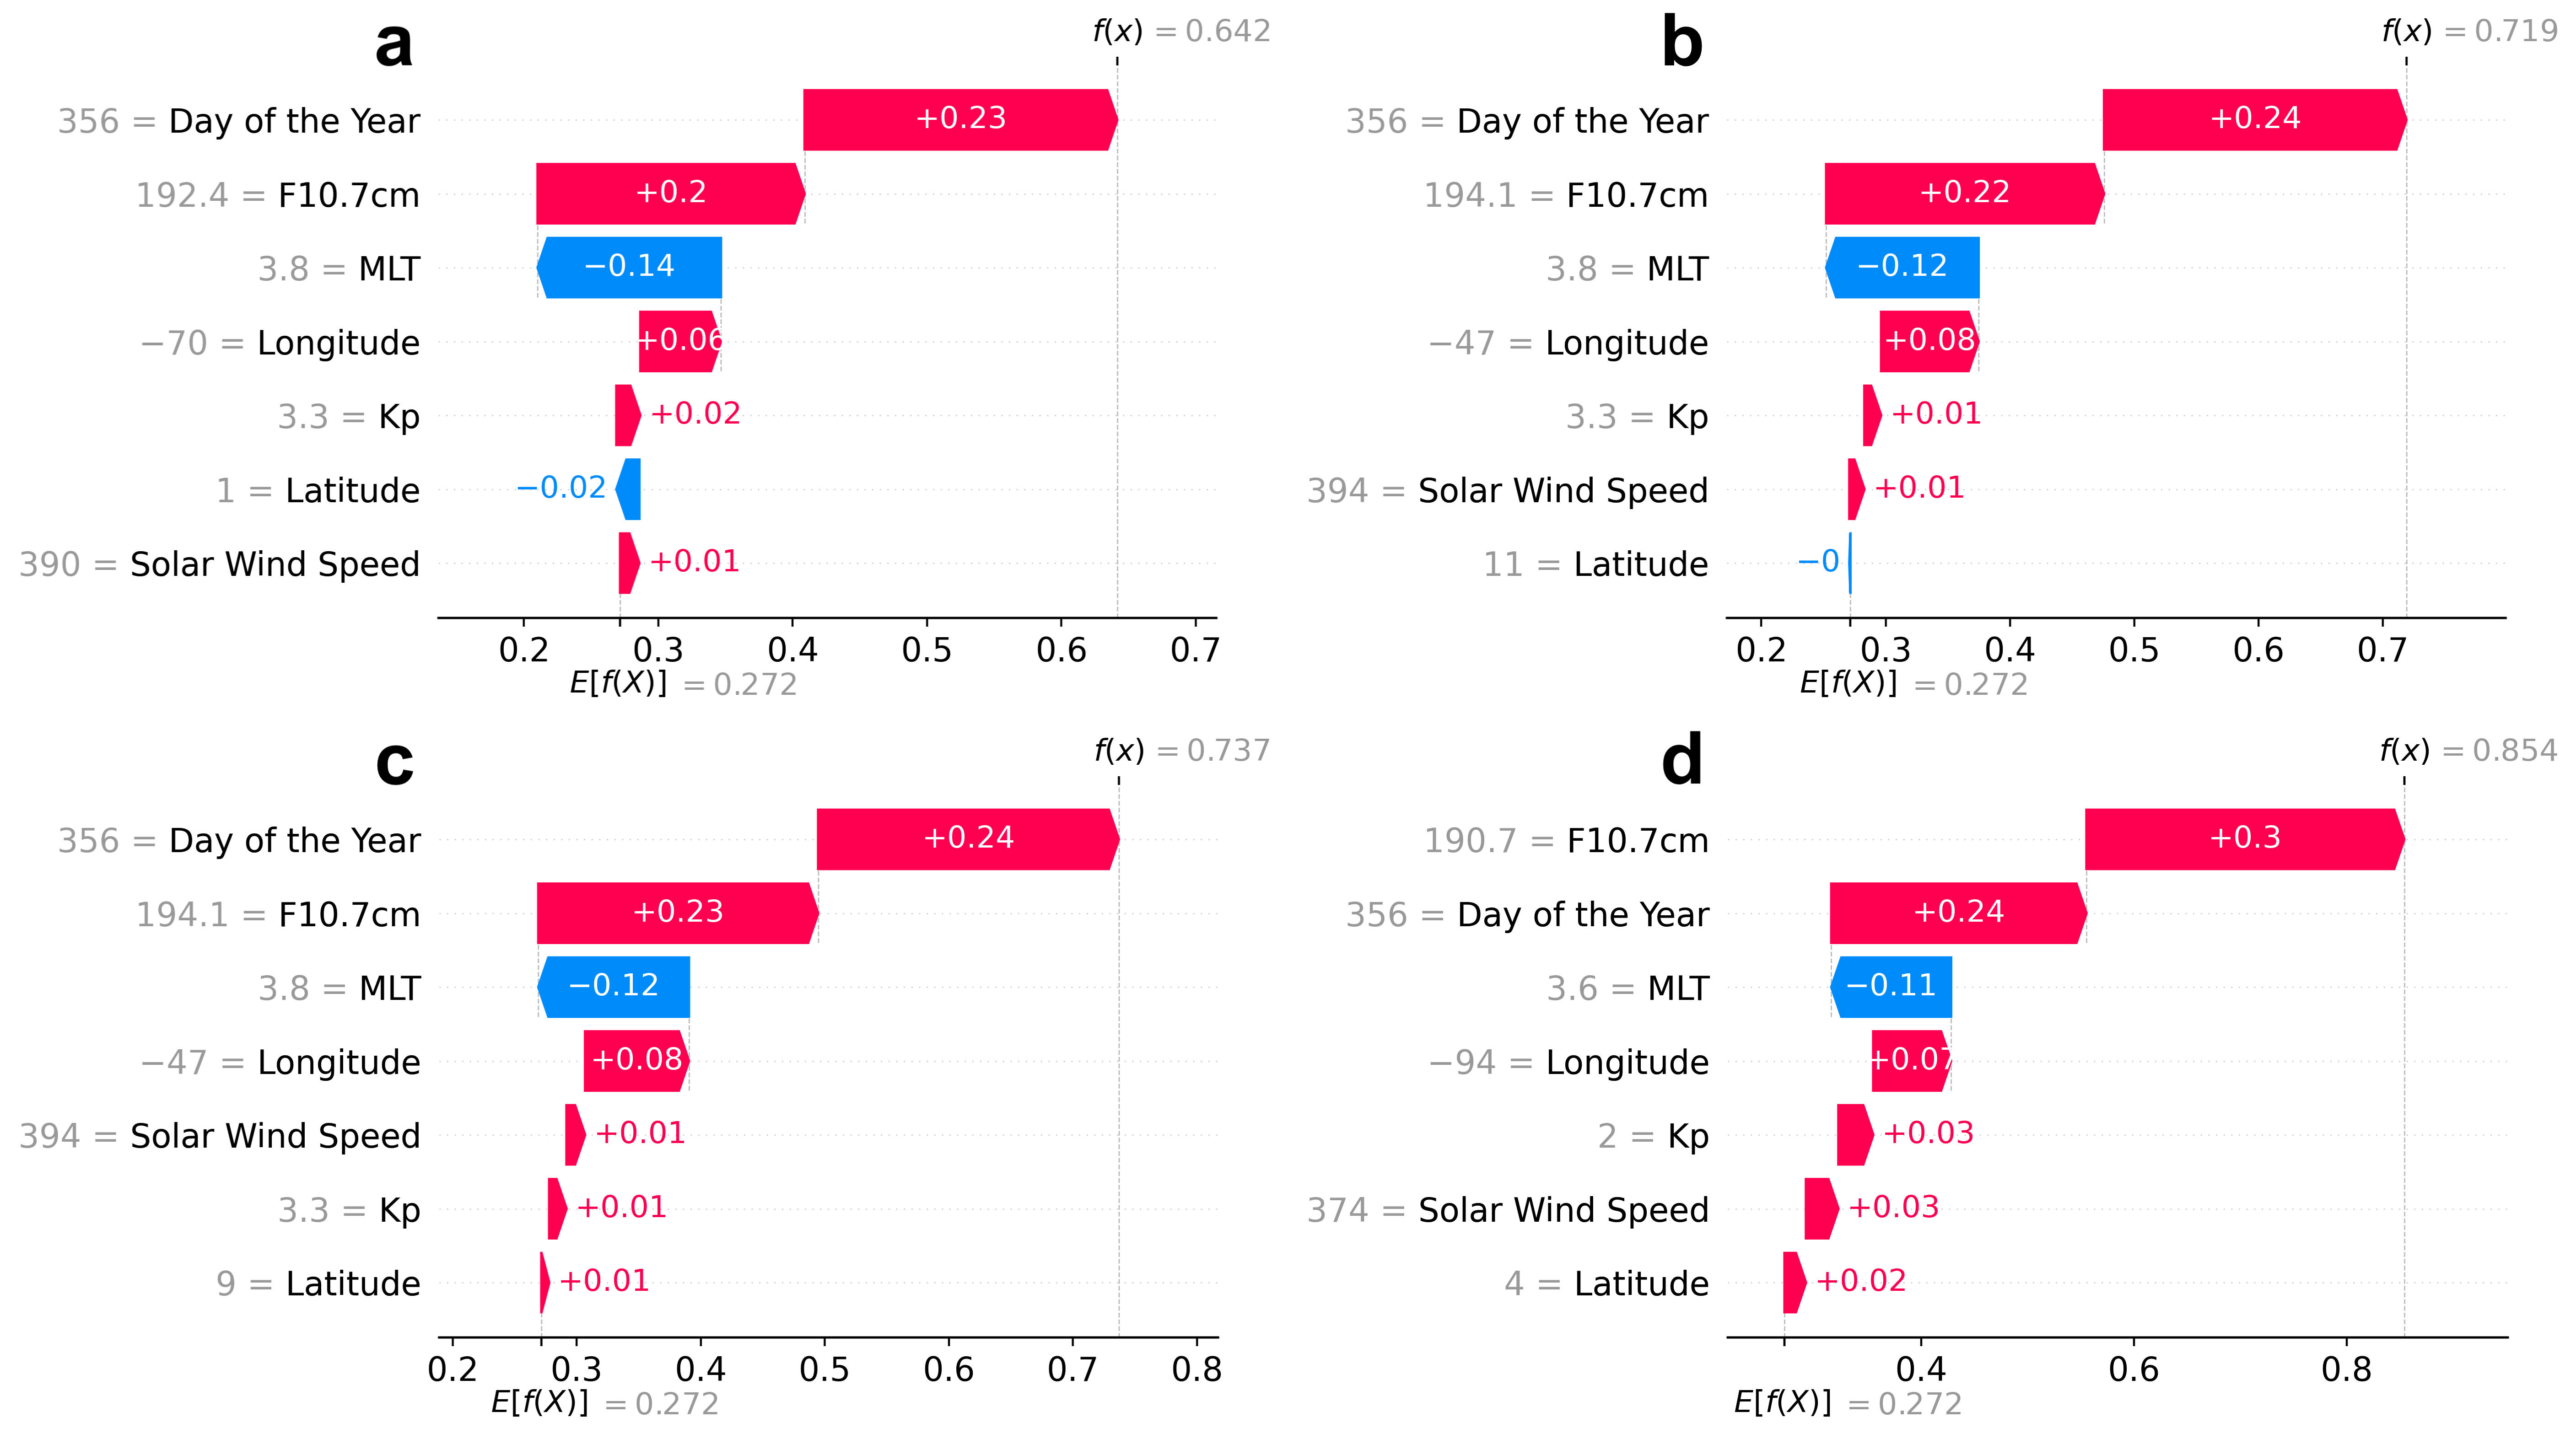
Shapley Values
Machine Learning is revolutionising our lives, however much remains unknown about how these models operate. For example, if a model makes a decision, we want to be able to ask it: “How and why did you make that decision?”. Shapley values help us understand how machines reason and thus we can better interpret the predictions they make. This is good for science, but it also helps ensure AI is ethical and safe.